Overall batch characteristics
Almut Lütge
15 April 2020
Batch Characteristics in single cell RNAseq
suppressPackageStartupMessages({
  library(scater)
  library(CellMixS)
  library(scales)
  library(purrr)
  library(circlize)
  library(viridis)
  library(jcolors)
  library(tidyr)
  library(dplyr)
  library(ComplexHeatmap)
  library(gridExtra)
  library(scran)
  library(magrittr)
  library(cowplot)
  library(colorspace)
})
Datasets
sce_name <- unlist(c(strsplit(params$sce_name, ",")))

sce_vec <- c(paste0(params$sce, sce_name, "_sce.rds"))
names(sce_vec) <- sce_name

meta_vec <- c(paste0(params$meta, sce_name, ".rds"))
names(meta_vec) <- sce_name

sce_small_vec <- c(paste0(params$sce_norm, sce_name, "_sce.rds"))
names(sce_small_vec) <- sce_name

sum_vec <- c(paste0(params$summary, sce_name, ".rds"))
names(sum_vec) <- sce_name

out_path_fig <- params$fig_res

cols <-c(c(jcolors('pal6'),jcolors('pal8'))[c(1,8,14,5,2:4,6,7,9:13,15:20)],jcolors('pal4'))
names(cols) <- c()
General
General summaries of the datasets as number of cells, genes, batches, batch origin
general_info <- lapply(sce_name, function(sce_nam){
  sce <- readRDS(sce_vec[sce_nam])
  meta <- readRDS(meta_vec[sce_nam])
  d <- data.frame("n_cells" = ncol(sce),
                  "n_genes" = nrow(sce),
                  "n_batches" = length(levels(as.factor(colData(sce)[,meta$batch]))),
                  "n_celltypes" = length(levels(as.factor(colData(sce)[,meta$celltype]))),
                  "linear" = mean(sce$cms.Xadj1),
                  "additive" = mean(sce$cms.Xadj2),
                  "interacting" = mean(sce$cms.Xadj3),
                  "reference" = mean(sce$cms))
}) %>% set_names(sce_name) %>% bind_rows() %>% set_rownames(sce_name)

general_info$batch_origin <- rep(NA, nrow(general_info))
general_info[c("pbmc2_media", "pbmc_roche", "csf_media"), "batch_origin"] <- "media"
general_info[c("csf_patient", "kang", "pbmc2_pat"), "batch_origin"] <- "patient"
general_info[c("pancreas", "cellbench", "hca"), "batch_origin"] <- "protocol"
general_info$dataset <- rownames(general_info)

general_info <- general_info %>% arrange(batch_origin)
rownames(general_info) <- general_info$dataset
Plot general infos
#colors
q_type <- qualitative_hcl(4, palette = "Dark 3")
col_type <- list("protocol" = q_type[1],
                     "media" = q_type[3], "patient" = q_type[4])

col_type_vec <- unlist(col_type[general_info$batch_origin])

q_batch <- sequential_hcl(5, palette = "BluYl")
col_batch <- colorRamp2(c(15, 10, 5, 3, 2), q_batch)

# annotations
h_cells <- HeatmapAnnotation(n_cells = anno_barplot(general_info$n_cells,
                                                    gp = gpar(fill = col_type_vec),
                                                    height = unit(2.2, "cm")))

h_genes <- HeatmapAnnotation(n_genes = anno_barplot(general_info$n_genes,
                                                    gp = gpar(fill = col_type_vec),
                                                    height = unit(2.2, "cm")))

# annotations plot (just for the manuscript plots)
h_cells <- HeatmapAnnotation(cells = anno_barplot(general_info$n_cells,
                                                    gp = gpar(fill = col_type_vec),
                                                    height = unit(2.2, "cm"),
                                                    axis_param = list(side = "right",
                                                                      gp = gpar(fontsize = 14),
                                                                      at = c(10000, 20000),
                                                                      labels = c("10K", "20K"))),
                            annotation_name_side = "left",
                            annotation_name_gp = gpar(fontsize = 18))

h_genes <- HeatmapAnnotation(genes = anno_barplot(general_info$n_genes,
                                                    gp = gpar(fill = col_type_vec),
                                                    height = unit(2.2, "cm"),
                                                    axis_param = list(side = "right",
                                                                      gp = gpar(fontsize = 15),
                                                                      at = c(10000, 20000),
                                                                      labels = c("10K", "20K"))),
                            annotation_name_side = "left",
                            annotation_name_gp = gpar(fontsize = 18))

h_data <- HeatmapAnnotation(dataset = anno_text(general_info$dataset,
                                                gp = gpar(fontsize = 18),
                                                rot = 45),
                            annotation_name_side = "left",
                            annotation_name_gp = gpar(fontsize = 18))


# heatmap
n_batches <- t(as.matrix(general_info[,c("n_batches", "n_celltypes")])) %>%
  set_colnames(general_info$dataset)


h_batch <- Heatmap(n_batches,
          cluster_rows = FALSE,
          cluster_columns = FALSE,
          name = "celltype/batch",
          column_names_side = "bottom",
          column_names_rot = 45,
          column_names_centered = TRUE,
          column_names_gp = gpar(fontsize = 8),
          row_names_side = "left",
          col = col_batch,
          rect_gp = gpar(col= "white"),
          show_heatmap_legend = FALSE)


#legends
lgd1 = Legend(labels = names(col_type), legend_gp = gpar(fill = unlist(col_type)),
              title = "batch origin")
lgd2 = Legend(col_fun = col_batch, at = c(0, 2, 5, 10, 15),
              title = "celltype/batch")
pd = packLegend(lgd1, lgd2)

lgd_short = Legend(labels = names(col_type),
                   legend_gp = gpar(fill = unlist(col_type)),
                   labels_gp = gpar(fontsize = 16),
                   grid_height = unit(6, "mm"),
                   grid_width = unit(6, "mm"),
                   title_gp = gpar(fontsize = 18, fontface = "bold"),
              title = "batch origin")

h_list <-  h_cells %v% h_genes %v% h_batch
h_list2 <-  h_cells %v% h_genes %v% h_data

draw(h_list, annotation_legend_list = pd)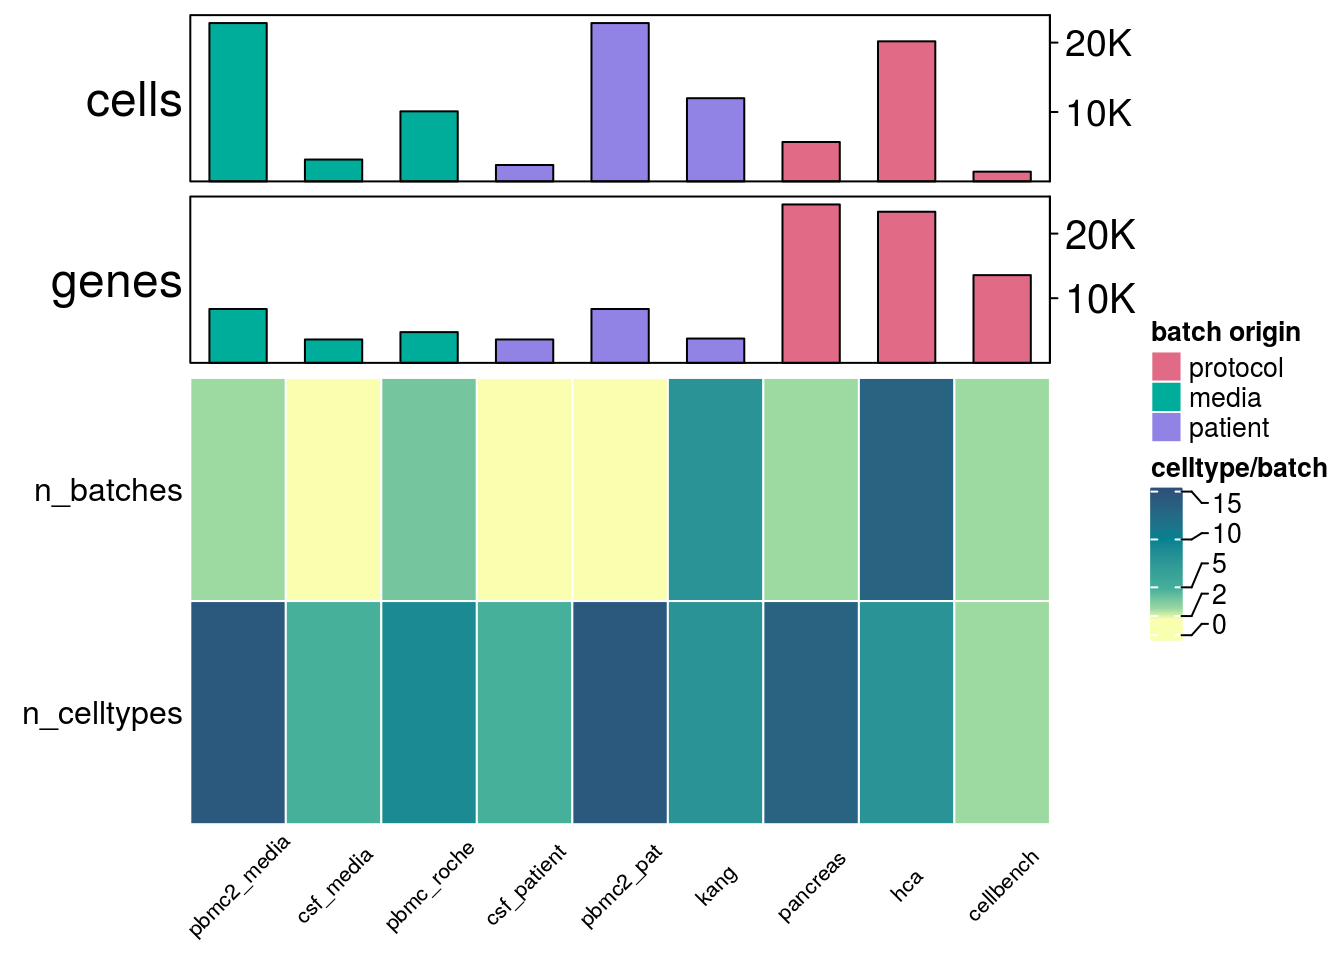
draw(h_list2, annotation_legend_list = lgd_short)
saveRDS(h_list, paste0(out_path_fig, "_general_info.rds"))
saveRDS(pd, paste0(out_path_fig, "_general_info_lgd.rds"))
saveRDS(h_list2, paste0(out_path_fig, "_general_info_short.rds"))
saveRDS(lgd_short, paste0(out_path_fig, "_general_info_short_lgd.rds"))
Batch size/strength
batch_size <- lapply(sce_name, function(sce_nam){
  sum <- readRDS(sum_vec[sce_nam])
  meta <- readRDS(meta_vec[sce_nam])
  d <- data.frame("PVE_batch" = sum$mean_var_batch,
                  "PVE_celltype" = sum$mean_var_celltype,
                  "mean_cms" = sum$mean_cms,
                  "DE_genes" = sum$mean_mean_n_de_genes)
}) %>% set_names(sce_name) %>% bind_rows() %>% set_rownames(sce_name)

batch_size$batch_origin <- general_info[rownames(batch_size), "batch_origin"]
batch_size$dataset <- rownames(batch_size)
batch_size <- batch_size %>% arrange(batch_origin)
Plot batch size parameter
#colors
q_cms <- sequential_hcl(5, palette = "YlOrRd")
col_cms = colorRamp2(c(0, 0.1, 0.2, 0.3, 0.5), q_cms)

q_size <- sequential_hcl(5, palette = "Reds")
col_size <- colorRamp2(c(0.2, 0.1, 0.03, 0.01, 0), q_size)

col_type <- c("protocol" = q_type[1], "media" = q_type[3], "patient" = q_type[4])

q_size2 <- sequential_hcl(5, palette = "Blues")
col_size2 <- colorRamp2(c(0.65, 0.5, 0.3, 0.2, 0.1), q_size2)

#annotation
ha_type = HeatmapAnnotation("batch_origin" = batch_size$batch_origin,
                            simple_anno_size = unit(1, "cm"),
                            col = list("batch_origin" = col_type),
                            annotation_height = unit(2.2, "cm"),
                            annotation_name_side = "left",
                            annotation_name_gp = gpar(fontsize = 20),
                            annotation_legend_param = list(labels_gp = gpar(fontsize = 12),
                                      title_gp = gpar(fontsize = 18)))

#heatmap
#cms
mean_cms <- t(as.matrix(batch_size$mean_cms))
colnames(mean_cms) <- batch_size$dataset
rownames(mean_cms) <- "mean_cms"

h_cms <- Heatmap(mean_cms,
          cluster_rows = FALSE,
          cluster_columns = FALSE,
          name = "cms",
          column_names_side = "bottom",
          column_names_rot = 45,
          column_names_centered = TRUE,
          column_names_gp = gpar(fontsize = 14),
          row_names_gp = gpar(fontsize = 20),
          row_names_side = "left",
          col = col_cms,
          rect_gp = gpar(col= "white"))

# mean variance part
n_batches <- t(as.matrix(batch_size[,c("PVE_batch", "PVE_celltype")])) %>%
  set_colnames(batch_size$dataset)

h_size1 <- Heatmap(n_batches,
          cluster_rows = FALSE,
          cluster_columns = FALSE,
          name = "variance",
          column_names_side = "bottom",
          column_names_rot = 0,
          column_names_centered = TRUE,
          column_names_gp = gpar(fontsize = 14),
          row_names_gp = gpar(fontsize = 20),
          row_names_side = "left",
          col = col_size,
          top_annotation = ha_type,
          rect_gp = gpar(col= "white"))


mean_de_genes <- t(as.matrix(batch_size$DE_genes))
colnames(mean_de_genes) <- batch_size$dataset
rownames(mean_de_genes) <- "DE_genes"

h_size2 <- Heatmap(mean_de_genes,
          cluster_rows = FALSE,
          cluster_columns = FALSE,
          name = "# genes",
          column_names_side = "bottom",
          column_names_rot = 0,
          column_names_centered = TRUE,
          column_names_gp = gpar(fontsize = 14),
          row_names_gp = gpar(fontsize = 20),
          row_names_side = "left",
          col = col_size2,
          rect_gp = gpar(col= "white"))

h_list <-  h_size1 %v% h_size2 %v% h_cms

draw(h_list)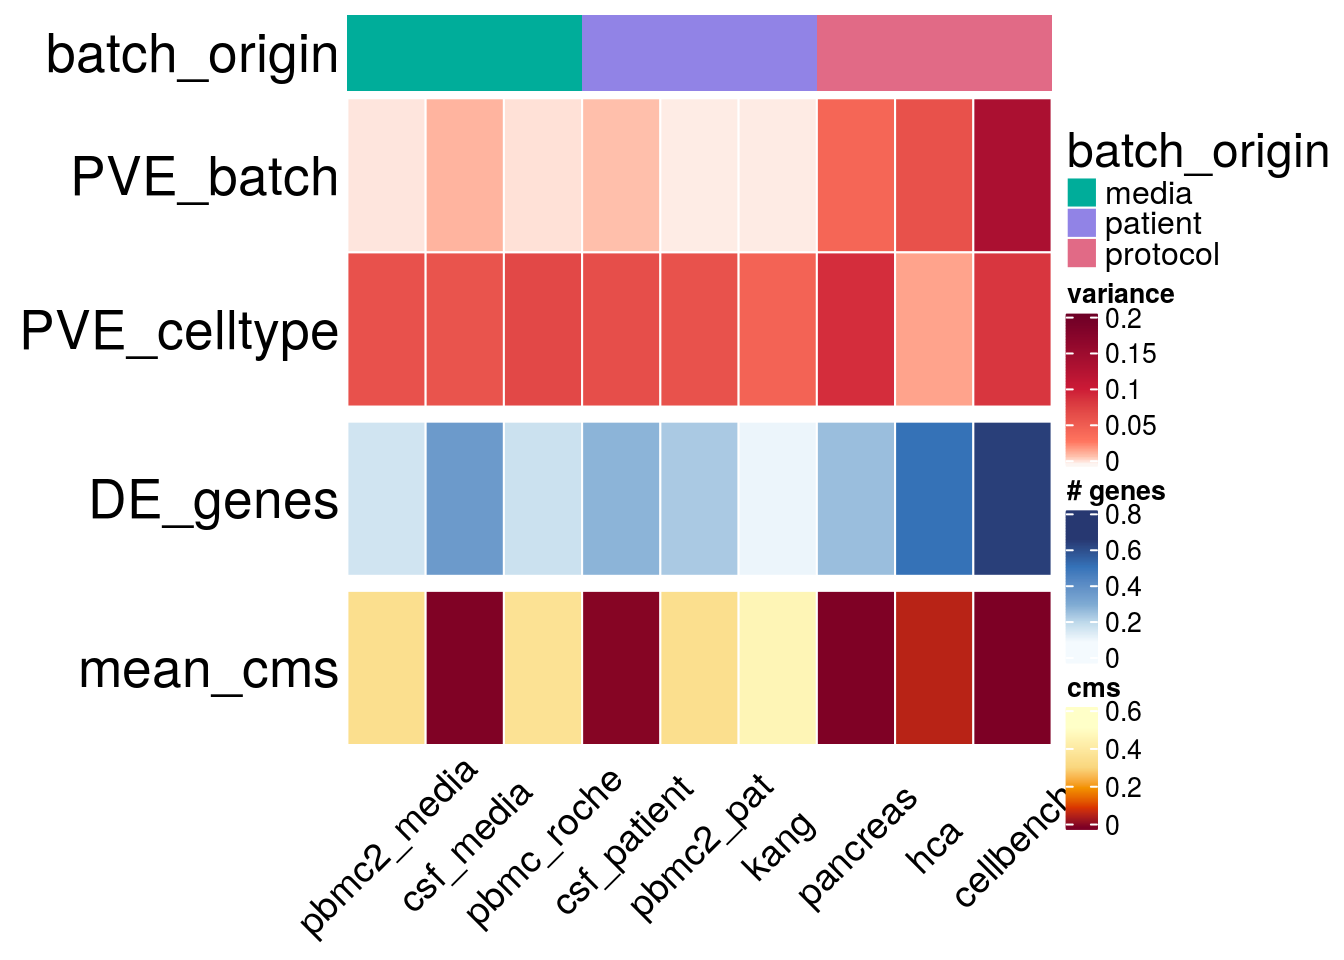
Generate plot object
h_size1 <- Heatmap(n_batches,
          cluster_rows = FALSE,
          cluster_columns = FALSE,
          name = "variance",
          column_names_side = "bottom",
          column_names_rot = 45,
          column_names_centered = TRUE,
          column_names_gp = gpar(fontsize = 14),
          row_names_gp = gpar(fontsize = 20),
          row_names_side = "left",
          col = col_size,
          heatmap_legend_param = list(labels_gp = gpar(fontsize = 12),
                                      title_gp = gpar(fontsize = 18)),
          top_annotation = ha_type,
          rect_gp = gpar(col= "white"))


DE_genes <- t(as.matrix(batch_size$DE_genes))
colnames(DE_genes) <- batch_size$dataset
rownames(DE_genes) <- "DE_genes"

h_size2 <- Heatmap(DE_genes,
          cluster_rows = FALSE,
          cluster_columns = FALSE,
          name = "# genes",
          column_names_side = "bottom",
          column_names_rot = 45,
          column_names_centered = TRUE,
          column_names_gp = gpar(fontsize = 14),
          row_names_gp = gpar(fontsize = 20),
          row_names_side = "left",
          col = col_size2,
          heatmap_legend_param = list(labels_gp = gpar(fontsize = 12),
                                      title_gp = gpar(fontsize = 18)),
          rect_gp = gpar(col= "white"))

h_list_plot <- h_size1 %v% h_size2

saveRDS(h_list_plot, paste0(out_path_fig, "_size_hm.rds"))
Batch type
#cols
q_cms <- sequential_hcl(5, palette = "Purple-Blue")
col_cms = colorRamp2(c(0, 0.1, 0.2, 0.3, 0.5), q_cms)

#annotation
ha_type = HeatmapAnnotation("batch_origin" = batch_size$batch_origin,
                            simple_anno_size =  unit(1, "cm"),
                            col = list("batch_origin" = col_type),
                            annotation_height = unit(2.2, "cm"),
                            annotation_name_side = "left",
                            annotation_name_gp = gpar(fontsize = 20),
                            annotation_legend_param = list(labels_gp = gpar(fontsize = 12),
                                      title_gp = gpar(fontsize = 18)))

#heatmap
#cms
type <- t(as.matrix(general_info[,c("reference","linear", "additive", "interacting")])) %>%
  set_colnames(batch_size$dataset)

h_cms <- Heatmap(type,
          cluster_rows = FALSE,
          cluster_columns = FALSE,
          name = "cms",
          column_names_side = "bottom",
          column_names_rot = 45,
          column_names_centered = TRUE,
          column_names_gp = gpar(fontsize = 14),
          row_names_gp = gpar(fontsize = 20),
          row_names_side = "left",
          heatmap_legend_param = list(labels_gp = gpar(fontsize = 12),
                                      title_gp = gpar(fontsize = 18)),
          col = col_cms,
          top_annotation = ha_type,
          rect_gp = gpar(col= "white"))

draw(h_cms)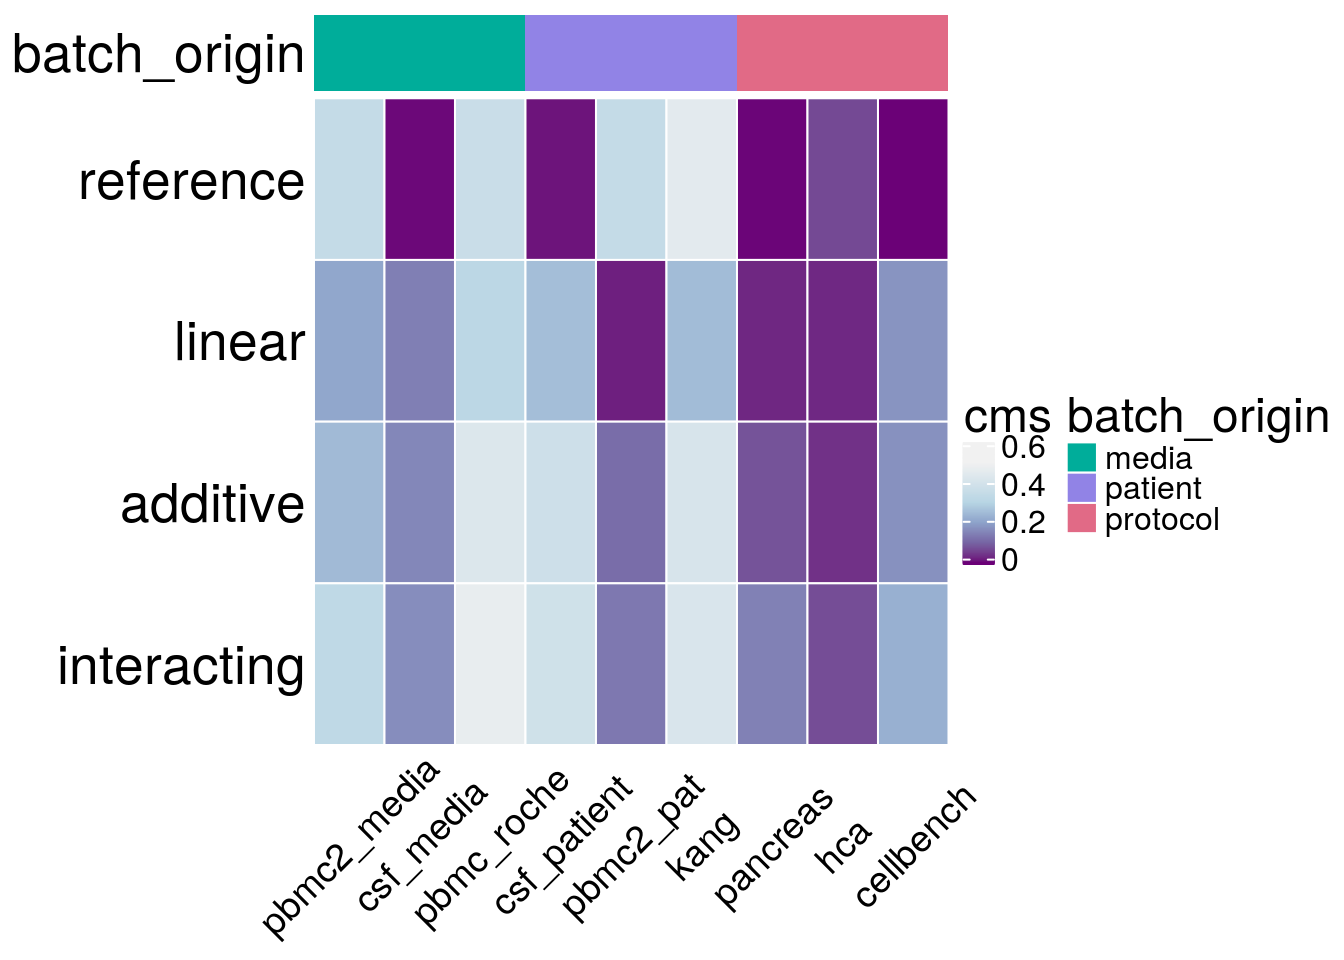
saveRDS(h_cms, paste0(out_path_fig, "_batch_type.rds"))Celltype specificity
Variables
ct_spec <- lapply(sce_name, function(sce_nam){
  sum <- readRDS(sum_vec[sce_nam])
  meta <- readRDS(meta_vec[sce_nam])
  d <- data.frame("celltype_var_cms" = sum$celltype_var_cms,
                  "mean_lfc_cor" = sum$mean_lfc_cor,
                  "mean_de_overlap" = sum$mean_de_overlap)
}) %>% set_names(sce_name) %>% bind_rows() %>% set_rownames(sce_name)

ct_spec$batch_origin <- general_info[rownames(ct_spec), "batch_origin"]
ct_spec$dataset <- rownames(ct_spec)
ct_spec <- ct_spec %>% arrange(batch_origin)
Plot celltype specificity
#colors
q_cms <- sequential_hcl(5, palette = "Reds")
col_cms = colorRamp2(c(0, 0.002, 0.004, 0.006, 0.008), q_cms)

q_cor <- rev(sequential_hcl(6, palette = "BluYl"))
col_cor <- colorRamp2(c(0, 0.2, 0.4, 0.6, 0.8, 0.9), q_cor)

col_type <- c("protocol" = q_type[1], "media" = q_type[3], "patient" = q_type[4])

q_over <- rev(sequential_hcl(6, palette = "RdPu"))
col_over <- colorRamp2(c(0, 0.1, 0.2, 0.3, 0.4, 0.5), q_over)

#annotation
ha_type = HeatmapAnnotation("batch_origin" = ct_spec$batch_origin,
                            simple_anno_size = unit(1, "cm"),
                            col = list("batch_origin" = col_type),
                            annotation_height = unit(2.2, "cm"),
                            annotation_name_side = "left",
                            annotation_name_gp = gpar(fontsize = 20),
                            annotation_legend_param = list(labels_gp = gpar(fontsize = 12),
                                      title_gp = gpar(fontsize = 18))
                            )

#heatmap
#cms
var_cms <- t(as.matrix(ct_spec$celltype_var_cms))
colnames(var_cms) <- ct_spec$dataset
rownames(var_cms) <- "var_cms"

h_cms <- Heatmap(var_cms,
          cluster_rows = FALSE,
          cluster_columns = FALSE,
          name = "cms variance",
          column_names_side = "bottom",
          column_names_rot = 45,
          column_names_centered = TRUE,
          column_names_gp = gpar(fontsize = 14),
          row_names_gp = gpar(fontsize = 20),
          row_names_side = "left",
          col = col_cms,
          rect_gp = gpar(col= "white"))

# correlation
cor_tab <- t(as.matrix(ct_spec$mean_lfc_cor))
colnames(cor_tab) <- ct_spec$dataset
rownames(cor_tab) <- "lfc_correlation"

h_cor <- Heatmap(cor_tab,
          cluster_rows = FALSE,
          cluster_columns = FALSE,
          name = "lfc correlation",
          column_names_side = "bottom",
          column_names_rot = 0,
          column_names_centered = TRUE,
          column_names_gp = gpar(fontsize = 14),
          row_names_gp = gpar(fontsize = 20),
          heatmap_legend_param = list(labels_gp = gpar(fontsize = 12),
                                      title_gp = gpar(fontsize = 18)),
          row_names_side = "left",
          col = col_cor,
          top_annotation = ha_type,
          rect_gp = gpar(col= "white"))

#just for figure plots
h_cor_fig <- Heatmap(cor_tab,
          cluster_rows = FALSE,
          cluster_columns = FALSE,
          name = "lfc correlation",
          column_names_side = "bottom",
          column_names_rot = 45,
          column_names_centered = TRUE,
          column_names_gp = gpar(fontsize = 14),
          row_names_gp = gpar(fontsize = 20),
          heatmap_legend_param = list(labels_gp = gpar(fontsize = 12),
                                      title_gp = gpar(fontsize = 18)),
          row_names_side = "left",
          col = col_cor,
          rect_gp = gpar(col= "white"))


over <- t(as.matrix(ct_spec$mean_de_overlap))
colnames(over) <- ct_spec$dataset
rownames(over) <- "de_overlap"

h_over <- Heatmap(over,
          cluster_rows = FALSE,
          cluster_columns = FALSE,
          name = "DE overlap",
          column_names_side = "bottom",
          column_names_rot = 45,
          column_names_centered = TRUE,
          column_names_gp = gpar(fontsize = 14),
          row_names_gp = gpar(fontsize = 20),
          row_names_side = "left",
          heatmap_legend_param = list(labels_gp = gpar(fontsize = 12),
                                      title_gp = gpar(fontsize = 18)),
          col = col_over,
          rect_gp = gpar(col= "white"))

h_list <-  h_cor %v% h_over %v% h_cms

draw(h_list)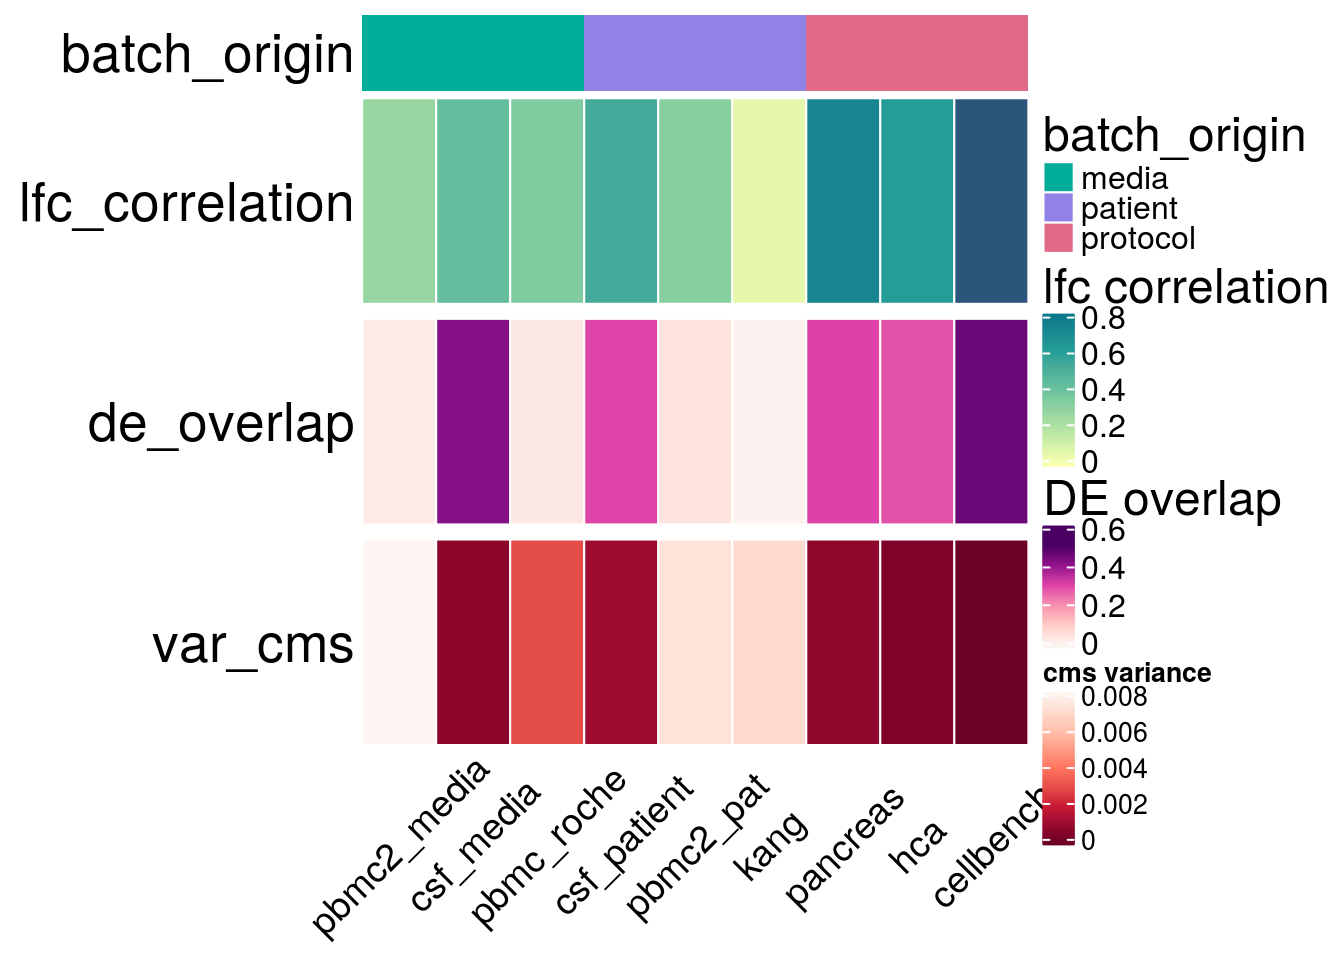
h_list_plot <-  h_cells %v% h_genes %v% h_size1 %v% h_size2 %v% h_cor_fig %v% h_over
saveRDS(h_list_plot, paste0(out_path_fig, "_ct_spec.rds"))
Distributions
gene_info <- lapply(sce_name, function(sce_nam){
  gc()
  sce <- readRDS(sce_vec[sce_nam])
  meta <- readRDS(meta_vec[sce_nam])
  d <- rowData(sce)[, grep("logFC", names(rowData(sce)))]
}) %>% set_names(sce_name)


ct_info <- lapply(sce_name, function(sce_nam){
  sce <- readRDS(sce_small_vec[sce_nam])
  meta <- readRDS(meta_vec[sce_nam])
  ct <- table(colData(sce)[, meta$celltype])
}) %>% set_names(sce_name)
logFC distributions
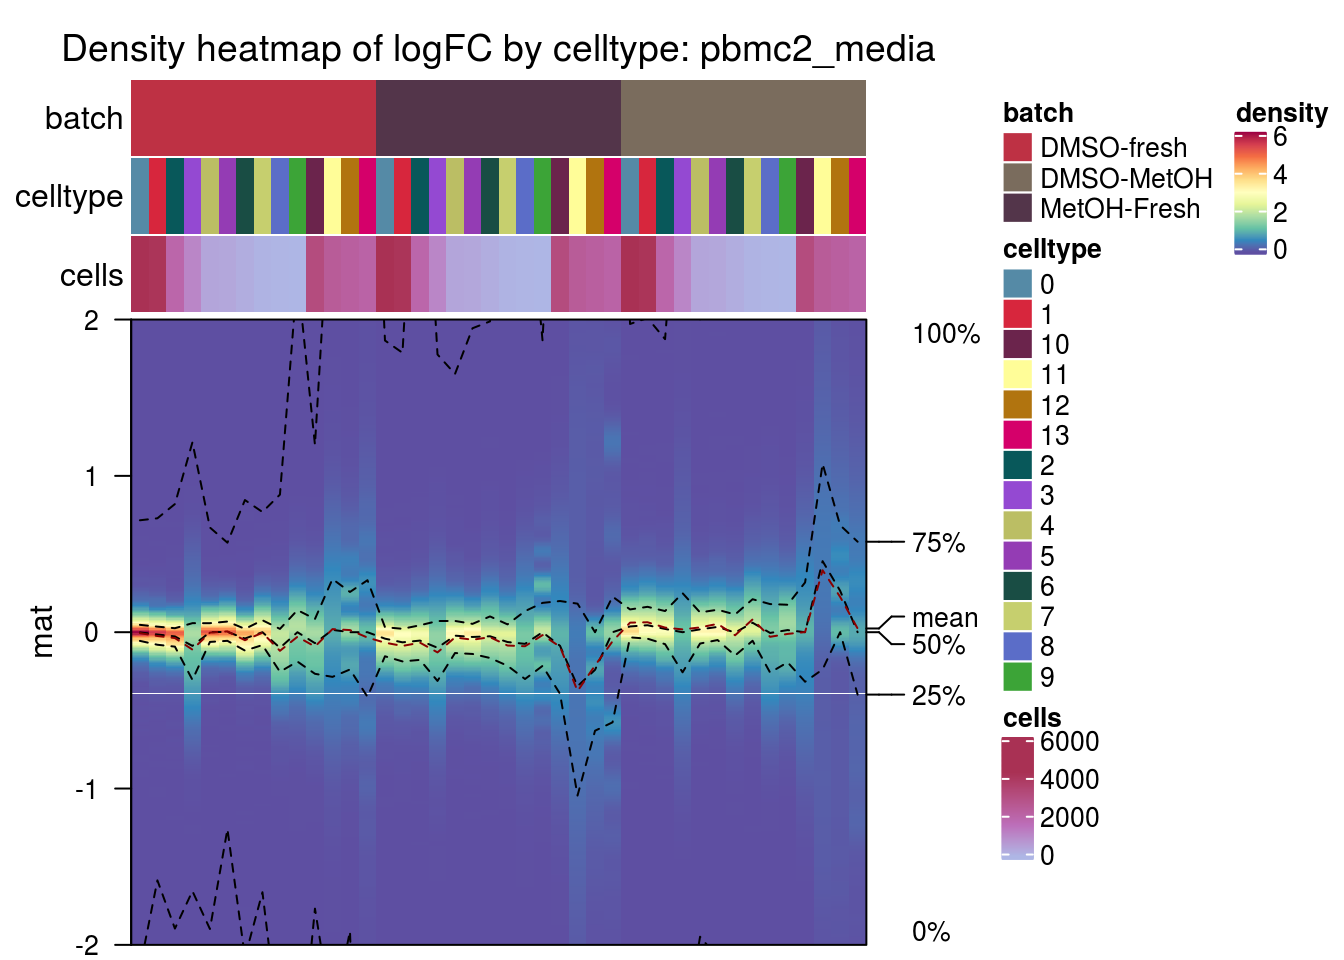
plot_den <- function(nam){
mat <- as.matrix(gene_info[[nam]])
ct <- ct_info[[nam]]
#col and factors
ba_tab <- data.frame("batch" = gsub("_.*","",colnames(mat)),
"celltype" = gsub(".*_logFC_", "", colnames(mat)))
ba_tab$cells <- ct[ba_tab$celltype]
col_den_b <- rev(cols)[3:(2 + length(levels(as.factor(ba_tab$batch))))] %>%
set_names(levels(as.factor(ba_tab$batch)))
col_den_c <- cols[1:length(levels(as.factor(ba_tab$celltype)))] %>%
set_names(levels(as.factor(ba_tab$celltype)))
q_cells <- sequential_hcl(3, palette = "Red-Blue")
col_cells <- colorRamp2(c(max(ct), mean(ct), min(ct)), q_cells)
#annotations
ha_den = HeatmapAnnotation("batch" = ba_tab$batch,
"celltype" = ba_tab$celltype,
"cells" = ba_tab$cells,
simple_anno_size = unit(1, "cm"),
col = list("batch" = col_den_b,
"celltype" = col_den_c,
"cells" = col_cells),
annotation_name_side = "left")
#heatmap
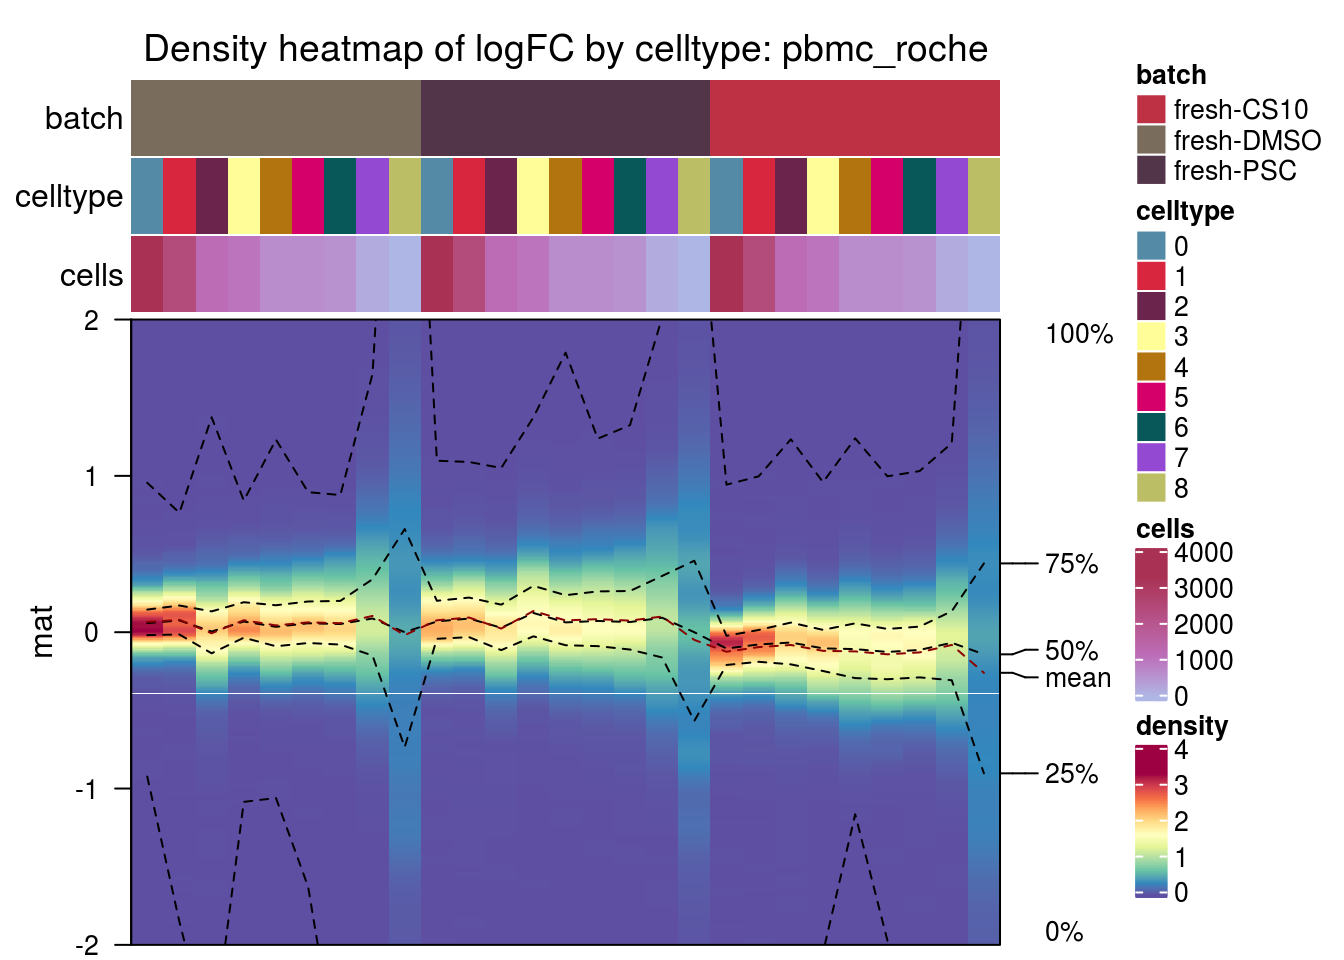
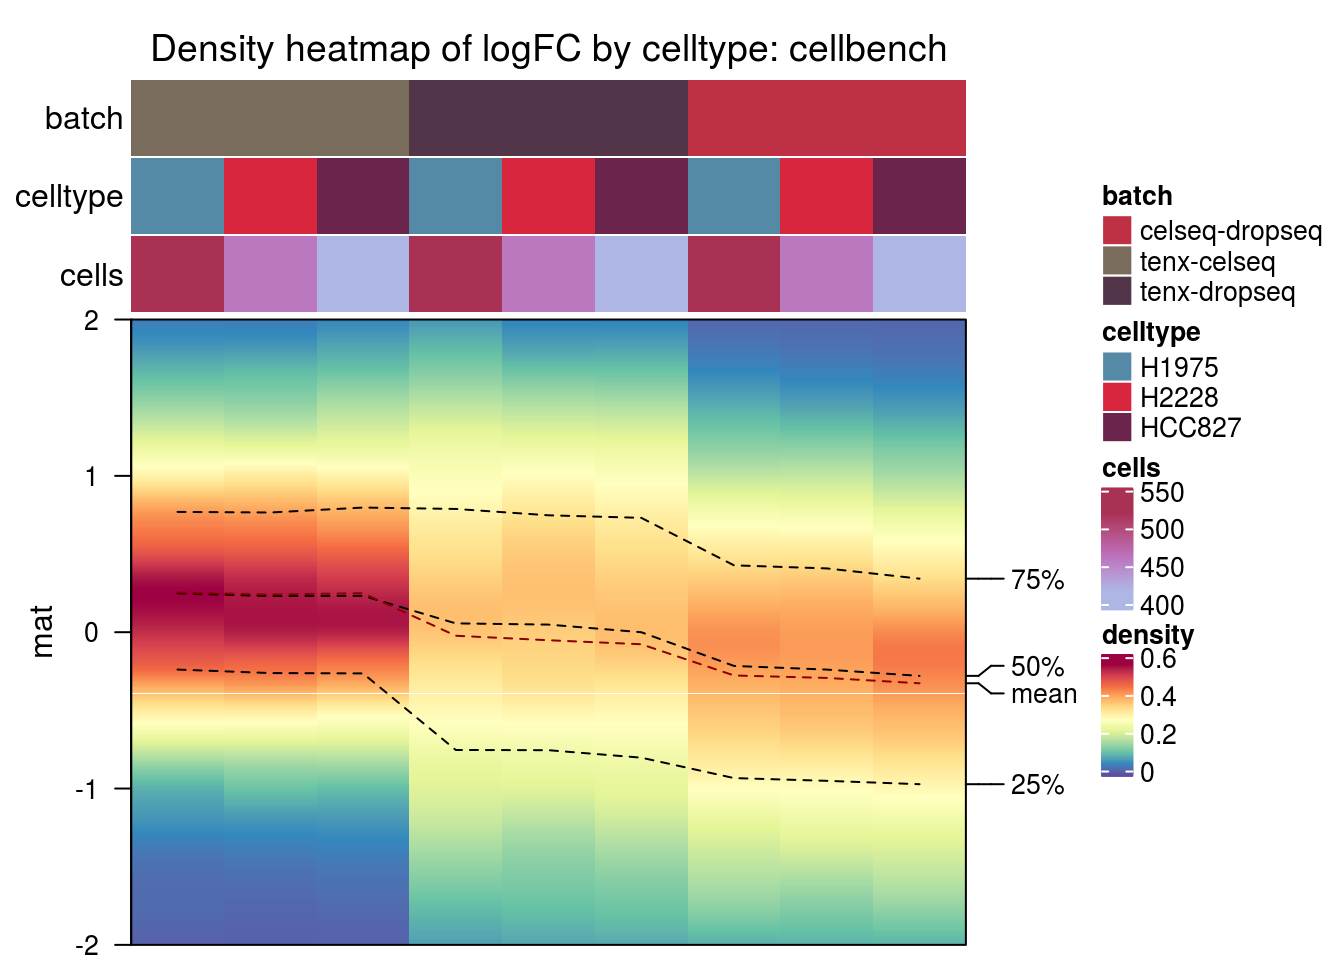
m <- densityHeatmap(mat,
ylim = c(-2, 2),
title = paste0("Density heatmap of logFC by celltype: ", nam),
top_annotation = ha_den,
show_column_names = FALSE
)
saveRDS(m, paste0(out_path_fig,"_", nam, "_lfc_dist.rds"))
draw(m)
}
template_density <- c(
"#### {{nam}}\n",
"```{r density{{nam}}, echo = FALSE}\n",
"m <- plot_den('{{nam}}')",
"```\n",
"\n"
)
plots_dens<- lapply(sce_name,
function(nam) knitr::knit_expand(text = template_density)
)pbmc2_media
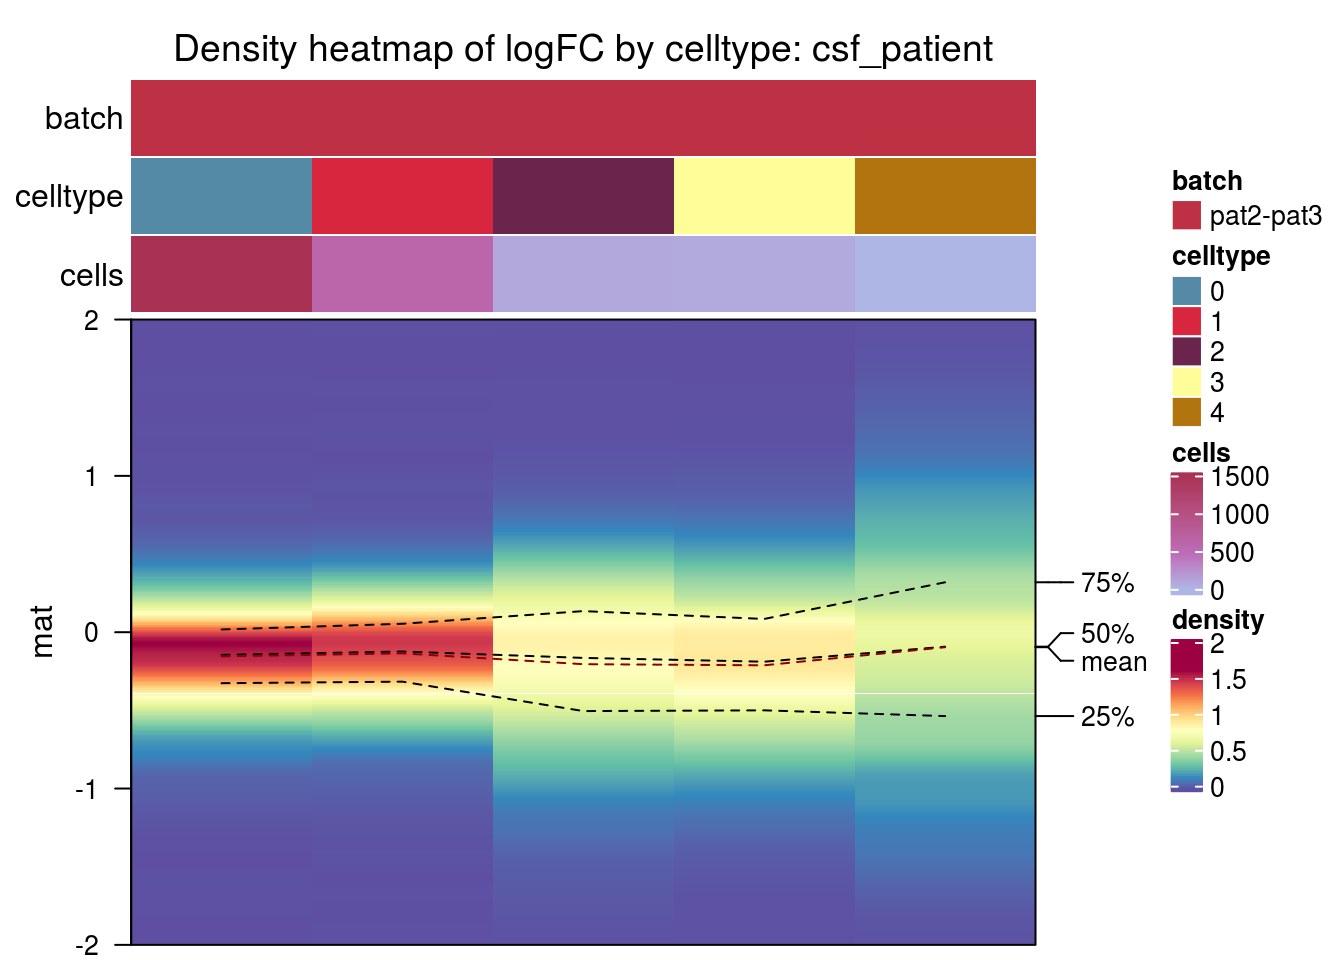
csf_patient
pancreas

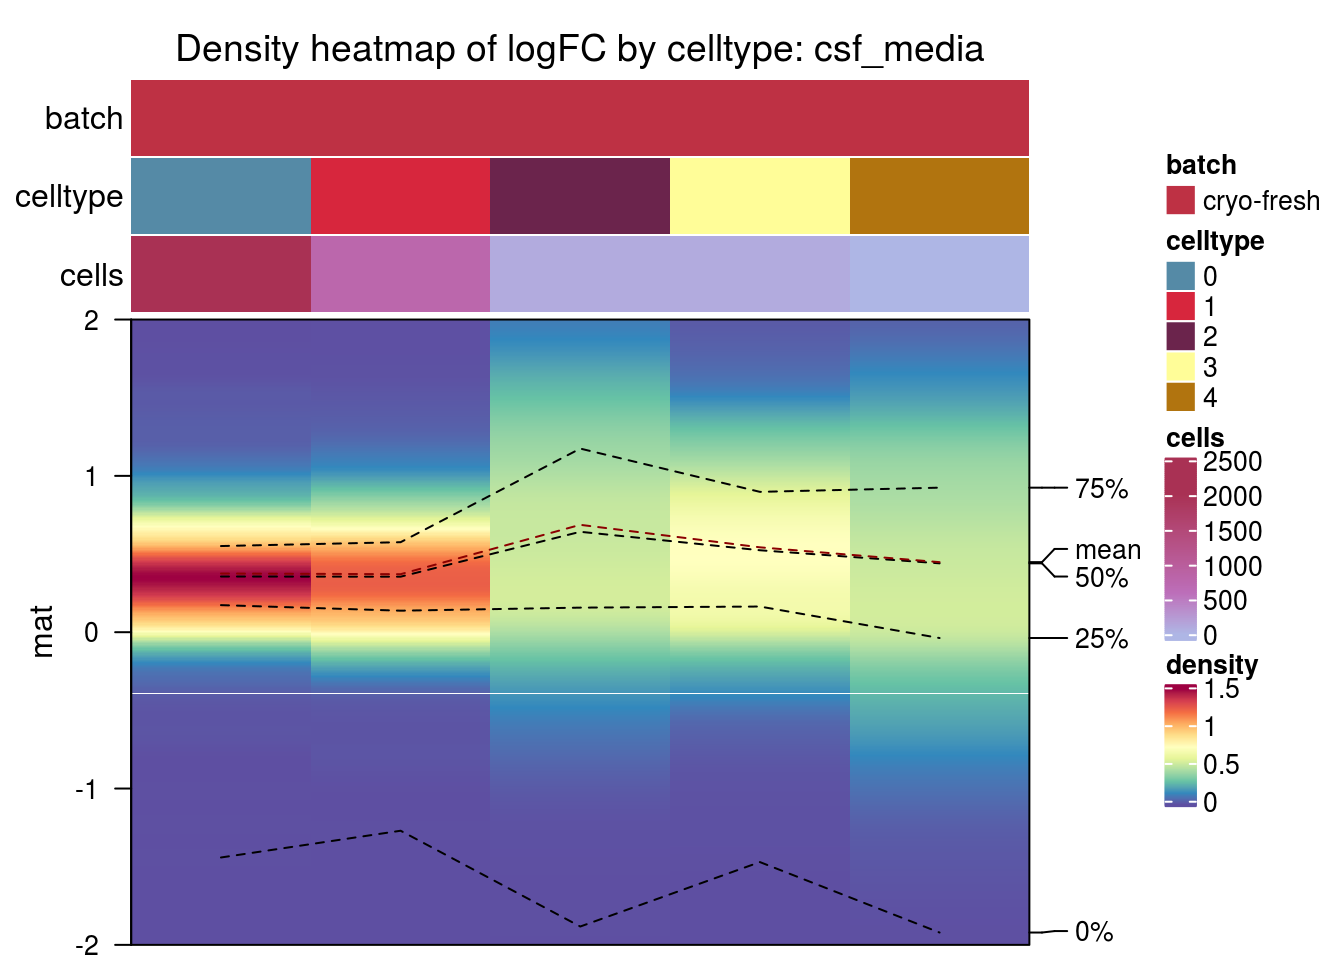
csf_media
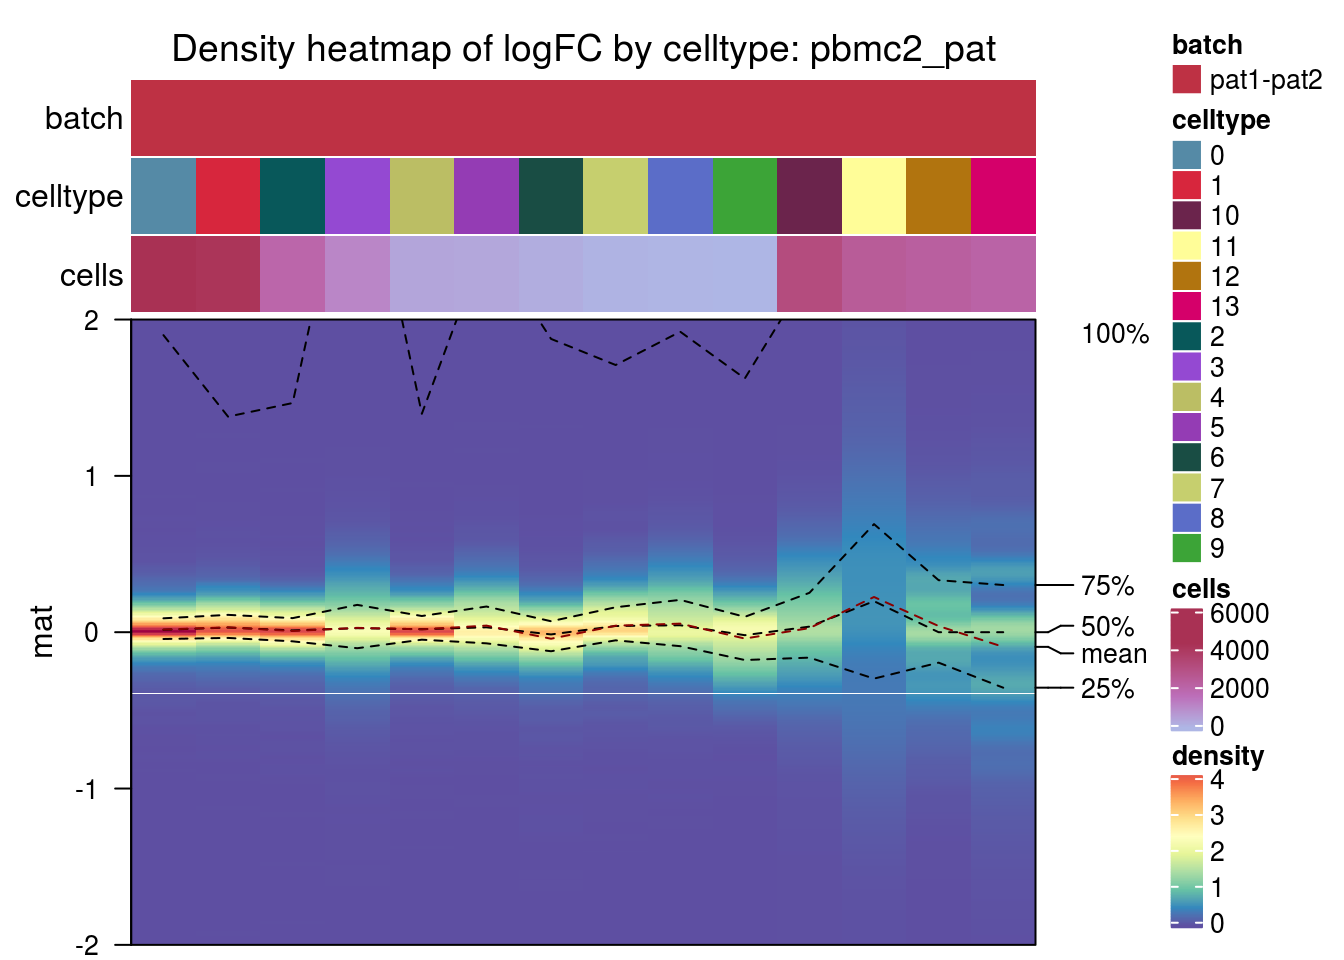
pbmc2_pat
hca

pbmc_roche
kang

cellbench
Further logFC plots
For figure plot
plot_den_fig <- function(nam){
  mat <- as.matrix(gene_info[[nam]])
  be <- gsub("_.*","",colnames(mat)) %>% as.factor() %>% levels()
  be <- be[1:ifelse(length(be > 3), 3, length(be))]
  mat <- mat[,grep(paste(be, collapse="|"), colnames(mat))]
  ct <- ct_info[[nam]]
  #col and factors
  ba_tab <- data.frame("batch" = gsub("_.*","",colnames(mat)),
                     "celltype" = gsub(".*_logFC_", "", colnames(mat)))
  ba_tab$cells <- ct[ba_tab$celltype]
  col_den_b <- rev(cols)[3:(2 + length(levels(as.factor(ba_tab$batch))))] %>%
  set_names(levels(as.factor(ba_tab$batch)))
  col_den_c <- cols[1:length(levels(as.factor(ba_tab$celltype)))] %>%
  set_names(levels(as.factor(ba_tab$celltype)))
  q_cells <- sequential_hcl(3, palette = "Red-Blue")
  col_cells <- colorRamp2(c(max(ct), mean(ct), min(ct)), q_cells)
  #annotations
  ha_den = HeatmapAnnotation("batch" = ba_tab$batch,
                            "cell_type" = ba_tab$celltype,
                            simple_anno_size = unit(0.8, "cm"),
                            col = list("batch" = col_den_b,
                                       "cell_type" = col_den_c,
                                       "cells" = col_cells),
                            show_legend = c(cell_type = FALSE),
                            annotation_name_side = "right",
                            annotation_name_gp = gpar(fontsize = 18),
                            annotation_legend_param = list(labels_gp = gpar(fontsize = 12),
                                                           title_gp = gpar(fontsize = 18)))
  #heatmap
  m <- densityHeatmap(mat,
                    ylab = "batch logFC",
                    ylim = c(-2, 2),
                    quantile_gp = gpar(fontsize = 14),
                    title = paste0(nam),
                    title_gp = gpar(fontsize = 18),
                    ylab_gp = gpar(fontsize = 18),
                    top_annotation = ha_den,
                    show_column_names = FALSE,
                    tick_label_gp = gpar(fontsize = 14),
                    heatmap_legend_param = list(labels_gp = gpar(fontsize = 12),
                                      title_gp = gpar(fontsize = 18)),
                    )
  saveRDS(m, paste0(out_path_fig,"_", nam, "_lfc_dist.rds"))
  draw(m)
}

plot_den_fig("pbmc2_pat")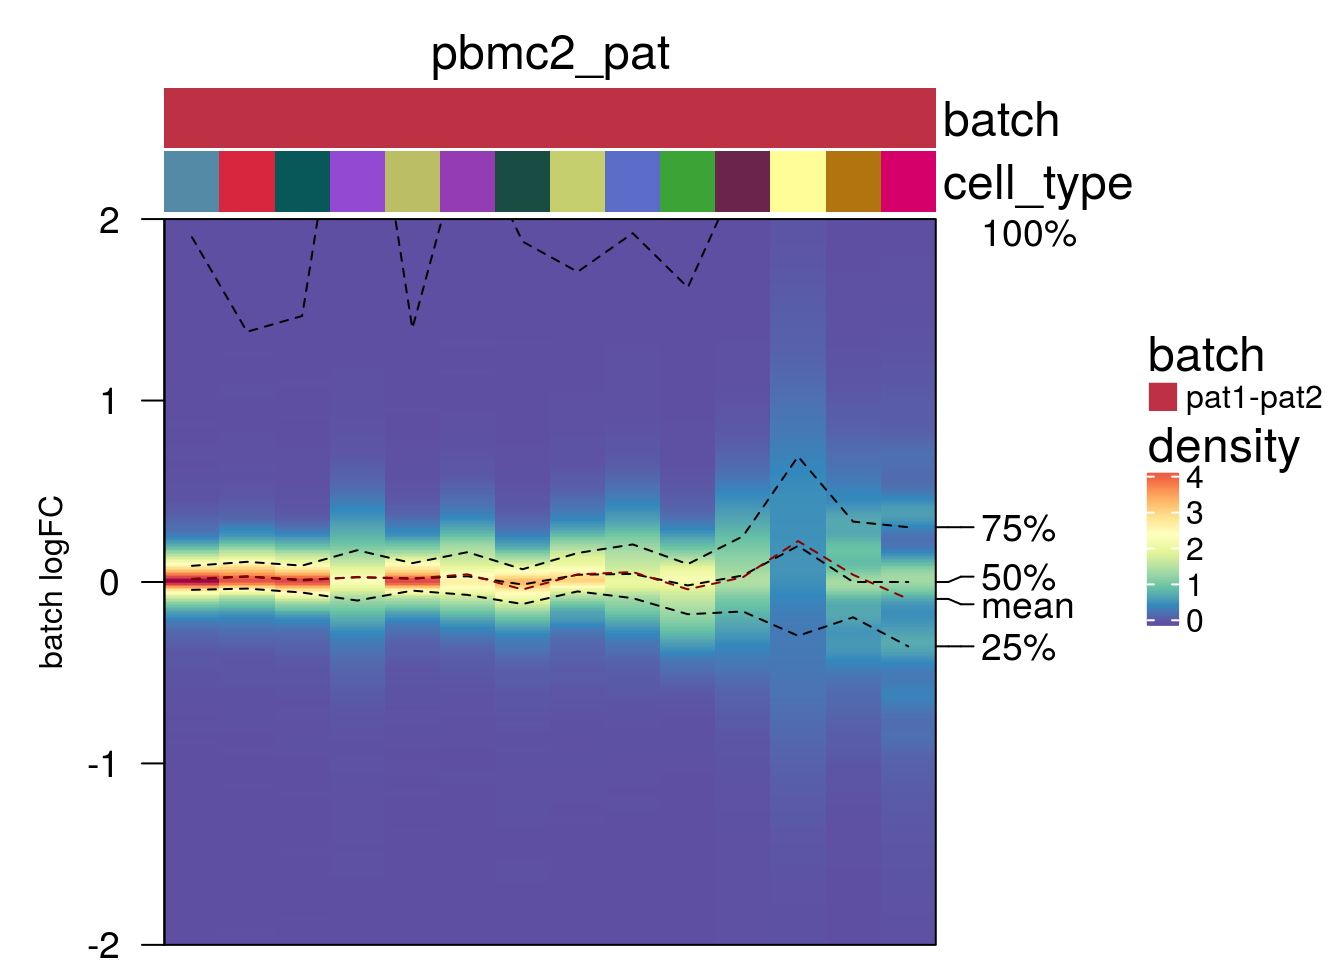
plot_den_fig("pbmc2_media")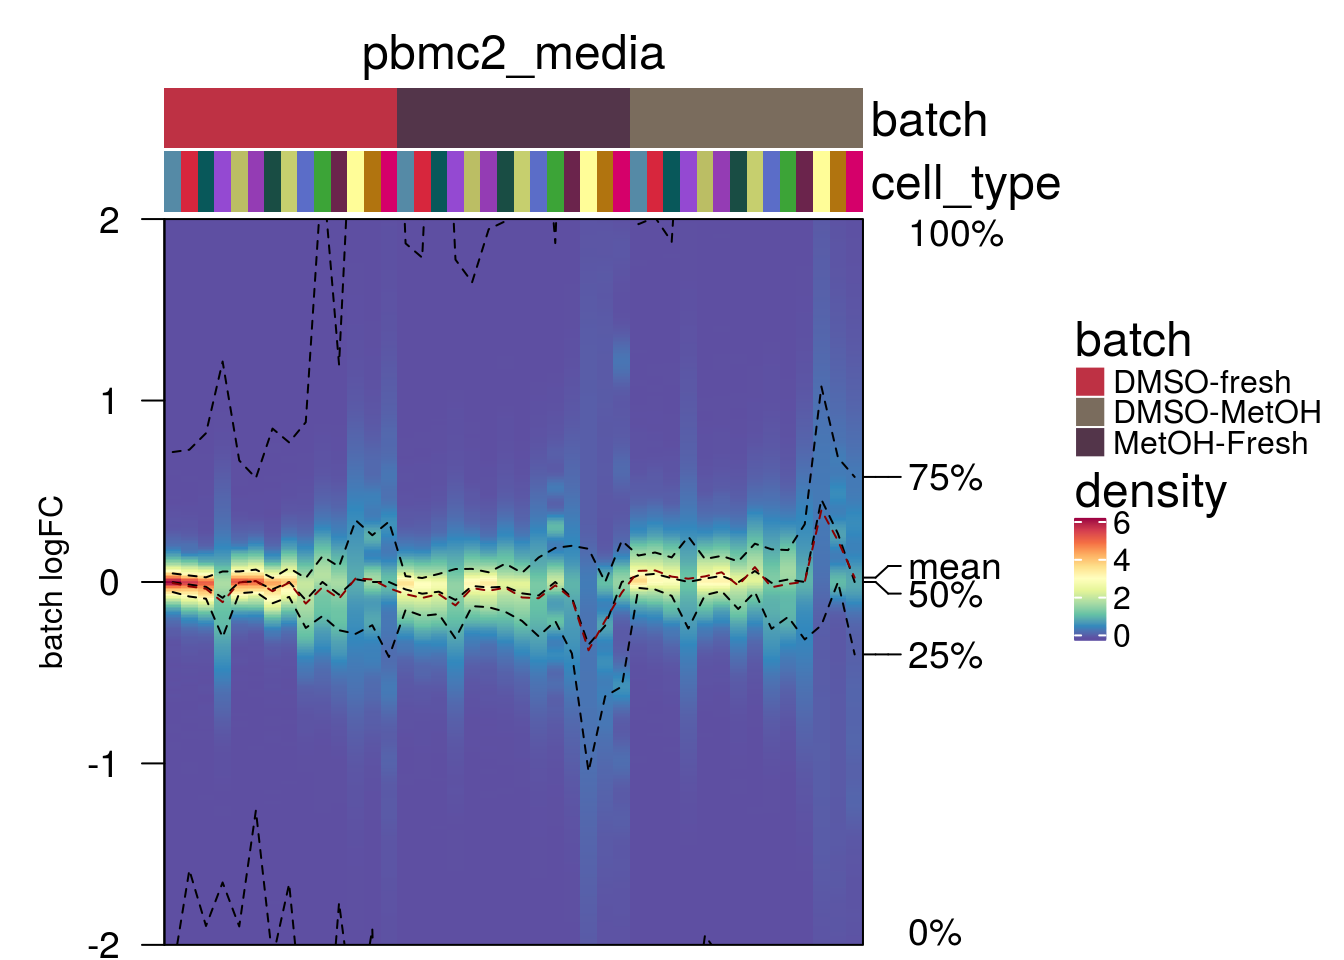
plot_den_fig("cellbench")
plot_den_fig("hca")
plot_den_fig("kang")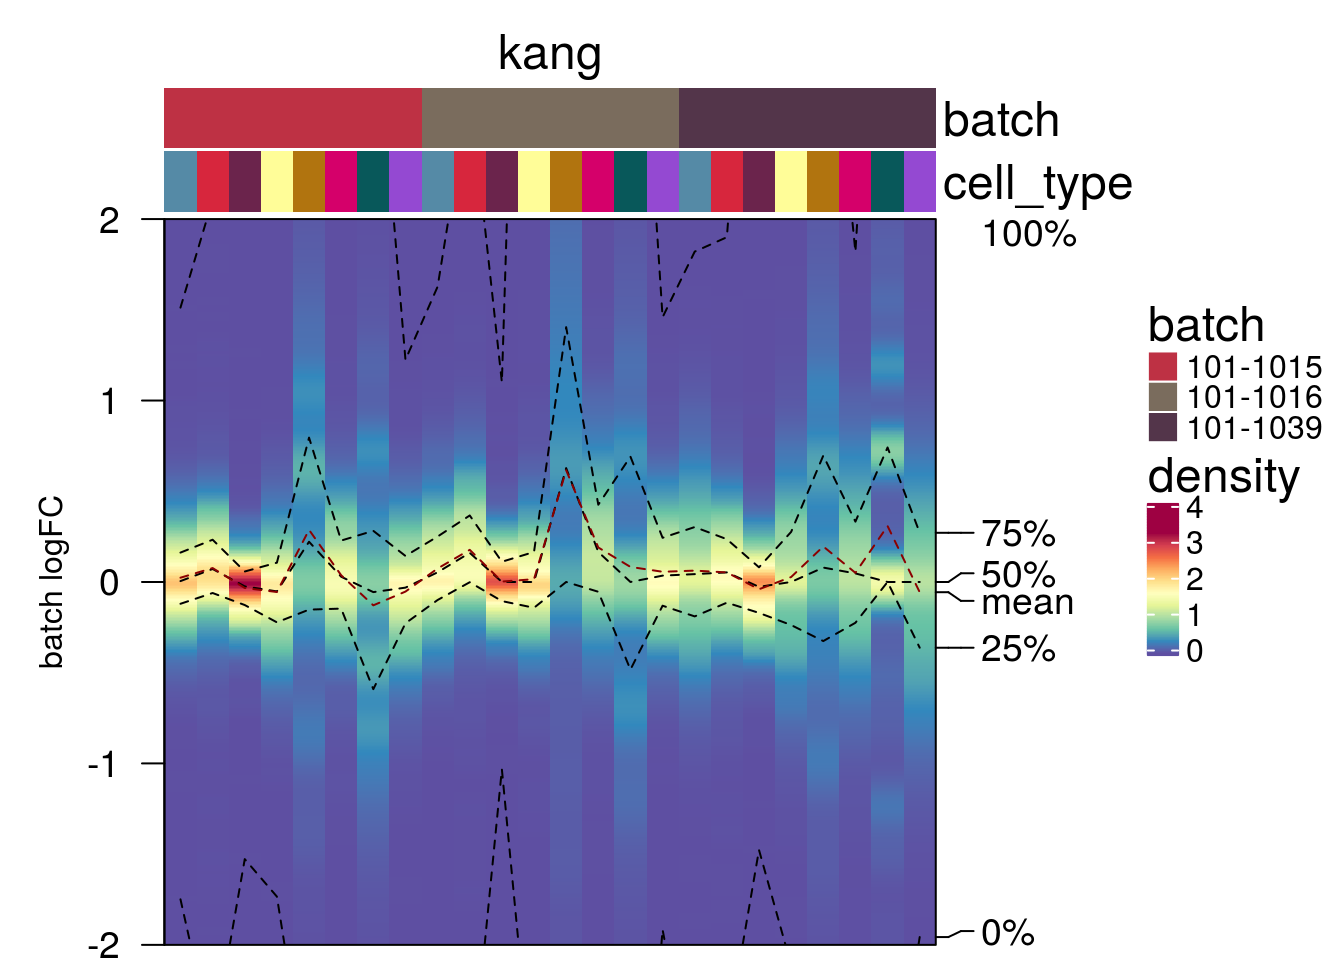
plot_den_fig("csf_media")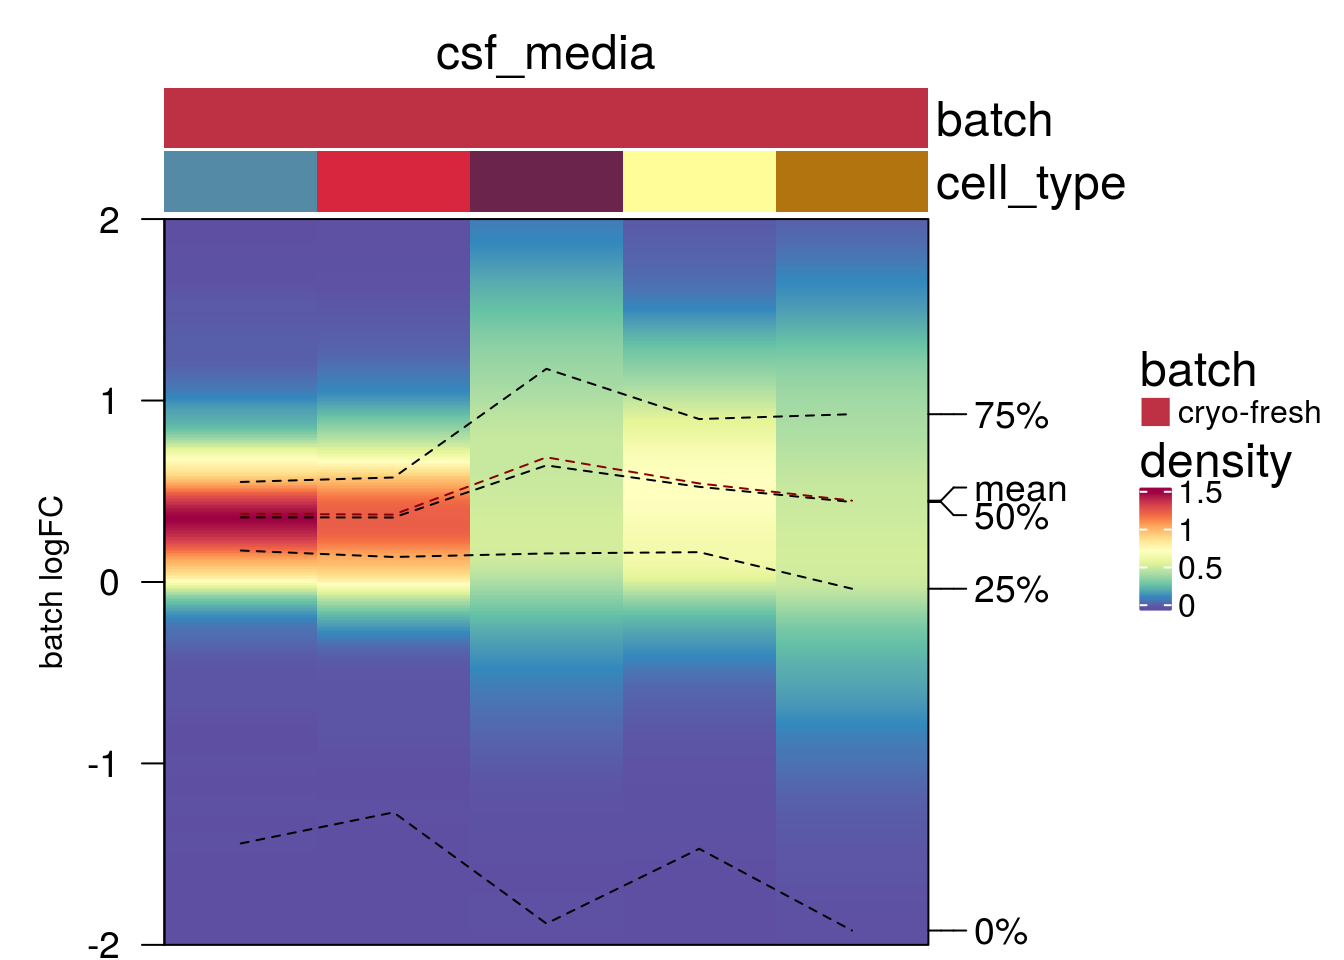
plot_den_fig("csf_patient")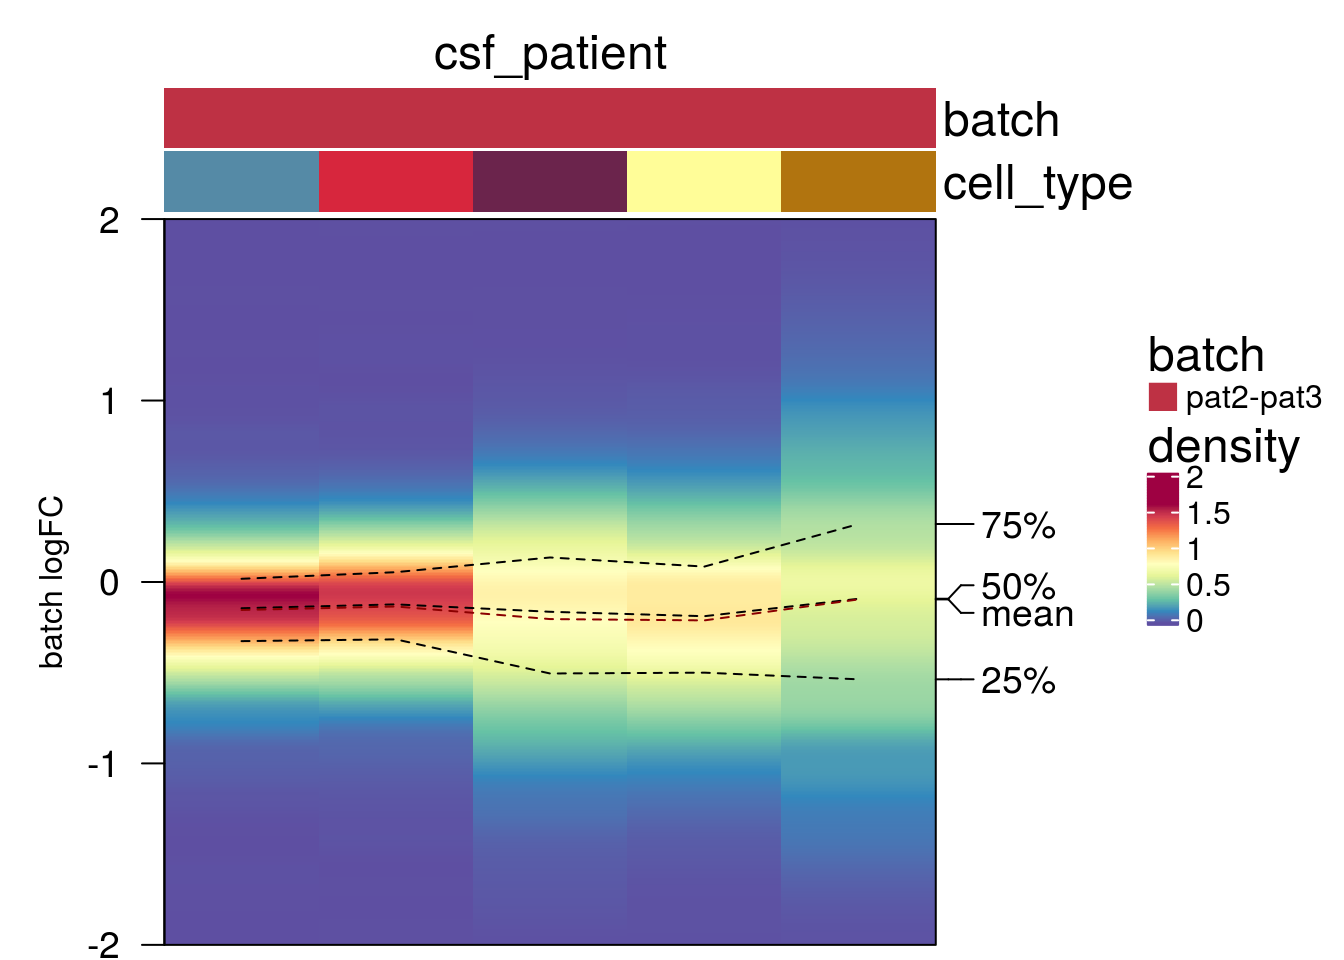
plot_den_fig("pbmc_roche")
LogFC distribution by celltype
plot_den_ct <- function(nam){
  mat <- as.matrix(gene_info[[nam]])
  be <- gsub("_.*","",colnames(mat)) %>% as.factor() %>% levels()
  be <- be[1:ifelse(length(be > 5), 5, length(be))]
  #mat <- mat[,grep(paste(be, collapse="|"), colnames(mat))]
  mat <-  mat[,sort(gsub(".*logFC_", "", colnames(mat)), index.return = TRUE)$ix]
  ct <- ct_info[[nam]]
  #col and factors
  ba_tab <- data.frame("batch" = gsub("_.*","",colnames(mat)),
                     "celltype" = gsub(".*_logFC_", "", colnames(mat)))
  ba_tab$cells <- ct[ba_tab$celltype]
  col_den_b <- rev(cols)[3:(2 + length(levels(as.factor(ba_tab$batch))))] %>%
  set_names(levels(as.factor(ba_tab$batch)))
  col_den_c <- cols[1:length(levels(as.factor(ba_tab$celltype)))] %>%
  set_names(levels(as.factor(ba_tab$celltype)))
  q_cells <- sequential_hcl(3, palette = "Red-Blue")
  col_cells <- colorRamp2(c(max(ct), mean(ct), min(ct)), q_cells)
  #annotations
  ha_den = HeatmapAnnotation("batch" = ba_tab$batch,
                            "cell_type" = ba_tab$celltype,
                            simple_anno_size = unit(0.8, "cm"),
                            col = list("batch" = col_den_b,
                                       "cell_type" = col_den_c,
                                       "cells" = col_cells),
                            show_legend = c(cell_type = FALSE),
                            annotation_name_side = "left",
                            annotation_name_gp = gpar(fontsize = 18),
                            annotation_legend_param = list(labels_gp = gpar(fontsize = 12),
                                                           title_gp = gpar(fontsize = 18)))
  #heatmap
  m <- densityHeatmap(mat,
                    ylim = c(-2, 2),
                    title = paste0(nam),
                    top_annotation = ha_den,
                    show_column_names = FALSE,
                    tick_label_gp = gpar(fontsize = 14),
                    heatmap_legend_param = list(labels_gp = gpar(fontsize = 12),
                                      title_gp = gpar(fontsize = 18)),
                    )
  saveRDS(m, paste0(out_path_fig,"_", nam, "_lfc_dist_by_ct.rds"))
  draw(m)
}

plot_den_ct("pbmc2_pat")
plot_den_ct("pbmc2_media")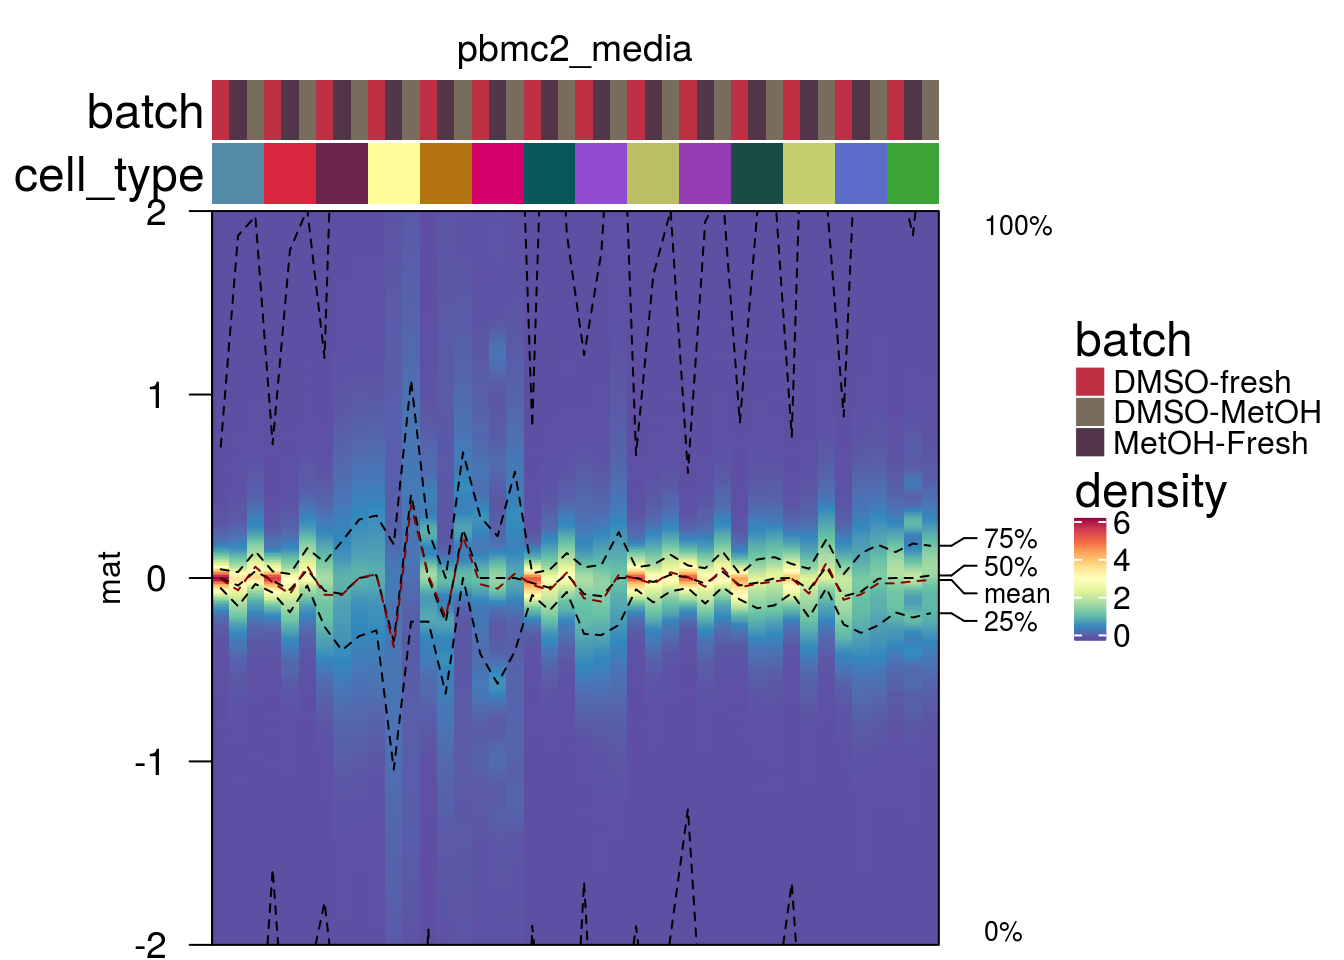
plot_den_ct("hca")
#plot_den_ct("pancreas")